Rolling to Win It:
The Probability Solution of Rolling A Pair of Dice
Abstract
In this lab report, the probability solution of rolling a pair of dice is recorded by rolling the pair exactly 100 times. On each pair of dice, it has the probability of rolling either numbers 1-12 to occur. In this experiment, resulting the rolling of the pair of dice, the outcome ranges from numbers 5-7, that are mostly occurred than the rests of the numbers. However, the outcome of six was the highest probability solution from the range of 5-7.
Engineering for Writing
Mena Elkafafi
March 21, 2019
Introduction
To win as much money at casinos or as many boardgames with your friends and family you must understand the secret of rolling a lucky seven. Going to casinos or playing monopoly with your friends, most of the time wagers are made on the outcome of rolling the pair of dice. That’s when probability comes in play and computes which number is most likely to occur to describe how much to wager on. In consideration, a pair of dice has 12 faces and out of the 12 chances it has the highest probability of rolling an outcome of seven because it has a 16.67% chance as seen on Figure 1.

Fig. 1- Probability of each sum.
Materials
- A pair of dice
- A pen
- A datasheet
- A calculator
Methods
For this experiment, you need to have a pair of equivalent dice to compute the outcome of the probability. A pen and a datasheet is required to record the different outcomes. After each roll, the sum of the two dice is added and then recorded on the datasheet. You must repeat this process at least 100 times and recorded each roll to attain proper data to formulate an accurate analysis.
Results
Subsequently, after recording the data of the 100 rolls, the results are shown on Figure 2 and Figure 3. Based on the given information, there a greater number of outcomes between the range of 5-7 compared to all the other outcomes. However, if you take in perspective the sum of 2 or the sum of 12 it has a low number of outcomes because it has the probability chance of 2.78%. In other words, the sum of the range 2-4 has a low probability chance as well the range from 9-12.

Fig. 2 – Number of Outcomes Bar Graph.

Fig. 3 – Number of Outcomes.
Analysis
Restating my hypothesis, I have stated that the lucky 7 would have the highest probability outcome of rolling a pair of dice. However, after conducting the experiment the possible outcomes of two dice are higher between the range 5-7 shown in Fig. 3 and Fig 4. Based on the data, the number of outcomes for the sum of seven was 17. Although, the number of outcomes for the sum of six was 19 and the sum of five was 11. There are more chances of rolling a pair of dice with a sum from 5-7 because there are many possible ways to roll that other possible sum as shown in Figure 4.
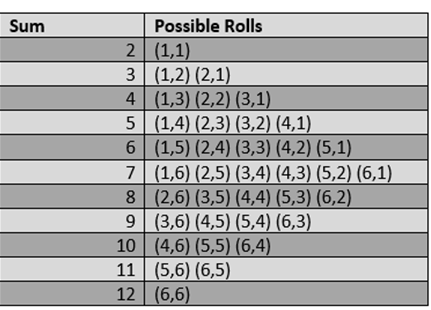
Fig. 4 – Possible ways to roll a pair of dice.
One specific study did a similar experiment however, instead only rolling a pair of dice they’re rolling three dice. They concluded that the most frequent sum was 9 and 10. However, there was a higher probability of the sum 10 than the sum of 9 as shown in Figure 5. “The justification is based on the list of all possibilities of how the sums 9 and 10 can be obtained with the three dice. There are more possibilities for the sum10 than for the sum 9 and this is the reason why the sum 10 occurs more frequently than the sum 9 in many repeated random experiments. Analogously, median sums are the most probable when summing the scores on several dice, because there are more possibilities to obtain them” (Lukac 38).

Fig. 5 – The frequencuy column graoh of indivual sums (Luckac 38).
Conclusion
After conducting the experiment, based on my stated hypothesis on rolling a pair of dice the most possible outcome would be seven. However, it was proven to be partially correct after conducting 100 trails of rolling the pair of dice the correct outcome was having a high probability from the range 5-7. This range had the most outcomes because it had an increase of probability to occur than the numbers two, three, four, eight, nine, ten, eleven, and twelve. Therefore, when playing in the casinos or trying to win a boardgame with your friends know you will know that the outcomes of five, six, and seven are more likely to be rolled than any other number of outcomes.
Works Cited
Lukac, Stanislav, and Radovan Engel. (vol. 66, no. 2, 2010, p. 30+) “Investigation of probability
distributions using dice rolling simulation.” Australian Mathematics Teacher. Academic OneFile, https://link.galegroup.com/apps/doc/A229718040/AONE?u=cuny_ccny&sid=AONE&xid=27cfcf59.
Arneson, Erik. (February 11, 2019) “Dice Probabilities – Rolling 2 Six-Sided Dice.”
Appendix
Table of 100 Number of Rolls with Number of Outcome
| Number of Rolls | Outcome of the Roll |
| 1 | 6 |
| 2 | 6 |
| 3 | 8 |
| 4 | 10 |
| 5 | 2 |
| 6 | 7 |
| 7 | 6 |
| 8 | 4 |
| 9 | 8 |
| 10 | 5 |
| 11 | 10 |
| 12 | 9 |
| 13 | 8 |
| 14 | 7 |
| 15 | 6 |
| 16 | 4 |
| 17 | 5 |
| 18 | 8 |
| 19 | 7 |
| 20 | 10 |
| 21 | 7 |
| 22 | 10 |
| 23 | 7 |
| 24 | 7 |
| 25 | 3 |
| 26 | 8 |
| 27 | 10 |
| 28 | 10 |
| 29 | 7 |
| 30 | 5 |
| 31 | 5 |
| 32 | 8 |
| 33 | 4 |
| 34 | 11 |
| 35 | 8 |
| 36 | 11 |
| 37 | 2 |
| 38 | 5 |
| 39 | 7 |
| 40 | 5 |
| 41 | 8 |
| 42 | 9 |
| 43 | 7 |
| 44 | 3 |
| 45 | 6 |
| 46 | 6 |
| 47 | 9 |
| 48 | 7 |
| 49 | 12 |
| 50 | 11 |
| 51 | 4 |
| 52 | 5 |
| 53 | 6 |
| 54 | 10 |
| 55 | 10 |
| 56 | 11 |
| 57 | 6 |
| 58 | 4 |
| 59 | 7 |
| 60 | 6 |
| 61 | 4 |
| 62 | 7 |
| 63 | 5 |
| 64 | 9 |
| 65 | 12 |
| 66 | 7 |
| 67 | 6 |
| 68 | 9 |
| 69 | 10 |
| 70 | 6 |
| 71 | 9 |
| 72 | 9 |
| 73 | 12 |
| 74 | 6 |
| 75 | 6 |
| 76 | 9 |
| 77 | 5 |
| 78 | 2 |
| 79 | 12 |
| 80 | 4 |
| 81 | 7 |
| 82 | 4 |
| 83 | 9 |
| 84 | 6 |
| 85 | 5 |
| 86 | 7 |
| 87 | 6 |
| 88 | 11 |
| 89 | 2 |
| 90 | 7 |
| 91 | 6 |
| 92 | 10 |
| 93 | 6 |
| 94 | 4 |
| 95 | 5 |
| 96 | 7 |
| 97 | 6 |
| 98 | 6 |
| 99 | 8 |
| 100 | 3 |